LMS analytics used to be something you checked after your big learning initiative launched. Maybe a few completion rates here, a few quiz scores there. 🎯
But in 2025?
LMS analytics aren’t just practical; they’re absolutely essential.
For L&D pros at SMEs, analytics are the difference between guesswork and game-changing strategy.
Let’s unpack what’s new, what to track, and how to make your data work harder.
First up…
What Are LMS Analytics?
LMS analytics are the data points that your learning platform collects as people interact with it, including logins, course completions, quiz results, feedback, and even the frequency of content revisits.
These insights tell you:
- What’s working?
- What’s flopping?
- Who’s flying ahead?
- And where support is needed.
Think of analytics as the GPS for your learning strategy.
Without it? You’re driving blind.
Why LMS Analytics Really Matters in 2025
Here’s what’s changed:
AI is no longer a nice-to-have; it’s baked into the best Learning Platforms (including Thirst, of course). 🚀
Learners want personalised, on-demand learning and data is how we serve that.
Businesses are no longer satisfied with just engagement metrics. They want concrete evidence of ROI, in the form of actual skills growth and performance impact. This shift in focus is where LMS analytics truly shine.
In short: LMS analytics = L&D credibility.
And for time-strapped SME teams, analytics tell you exactly where to double down (and where to pivot fast).
Why not take a look at our New Feature: AI Quiz Generator?
10 LMS Analytics Metrics You Should Be Tracking
It’s time to get tactical.
Here are 10 metrics that matter and what each one tells you.
1. Course Completion Rate
A classic but still crucial.
High completion = high relevance, clarity, and learner motivation.
Low completion? Time to dig into why.
2. Learner Engagement
Logins. Time spent. Frequency. These tell you who’s showing up and who’s ghosting your content.
Take a look at how Thirst helps boost learner engagement
3. Assessment Scores & Pass Rates
Don’t just track who passed, track how well they did. It reveals if content is hitting the right level (or needs tweaking).
4. Drop-Off Points
Where are learners exiting a course? This metric shows where engagement dies and where to optimise.
5. Time to Completion
How long does it take to finish a module? Useful for spotting bottlenecks or overly long content.
6. Content Ratings & Feedback
Don’t overlook qualitative data. Learner feedback tells you what they really think and where you might be missing the mark.
7. Learning Path Progression
Are learners following your planned journeys? Or bouncing around? This data helps refine your learning architecture.
8. Skills Development & Competency Tracking
More platforms now let you map learning to real-world skills. This is how you connect L&D to business outcomes.
Take a look at how Thirst can support your team with Skills Development.
9. Repeat Views & Re-engagement
Which content do learners come back to? That’s your gold standard. Replicate it.
10. Learning ROI & Business Impact
This one’s big. Track how learning translates into productivity, performance or retention. Not always easy, but worth it.
What’s New in LMS Analytics for 2025?
The best platforms in 2025 are way beyond spreadsheets.
Here’s what’s shaking up the game:
AI-Generated Insights ✅
Your LMS can now tell you:
“These 10 users are likely to disengage in the next 7 days.”
That’s not science fiction, it’s real-time intervention, powered by predictive analytics.
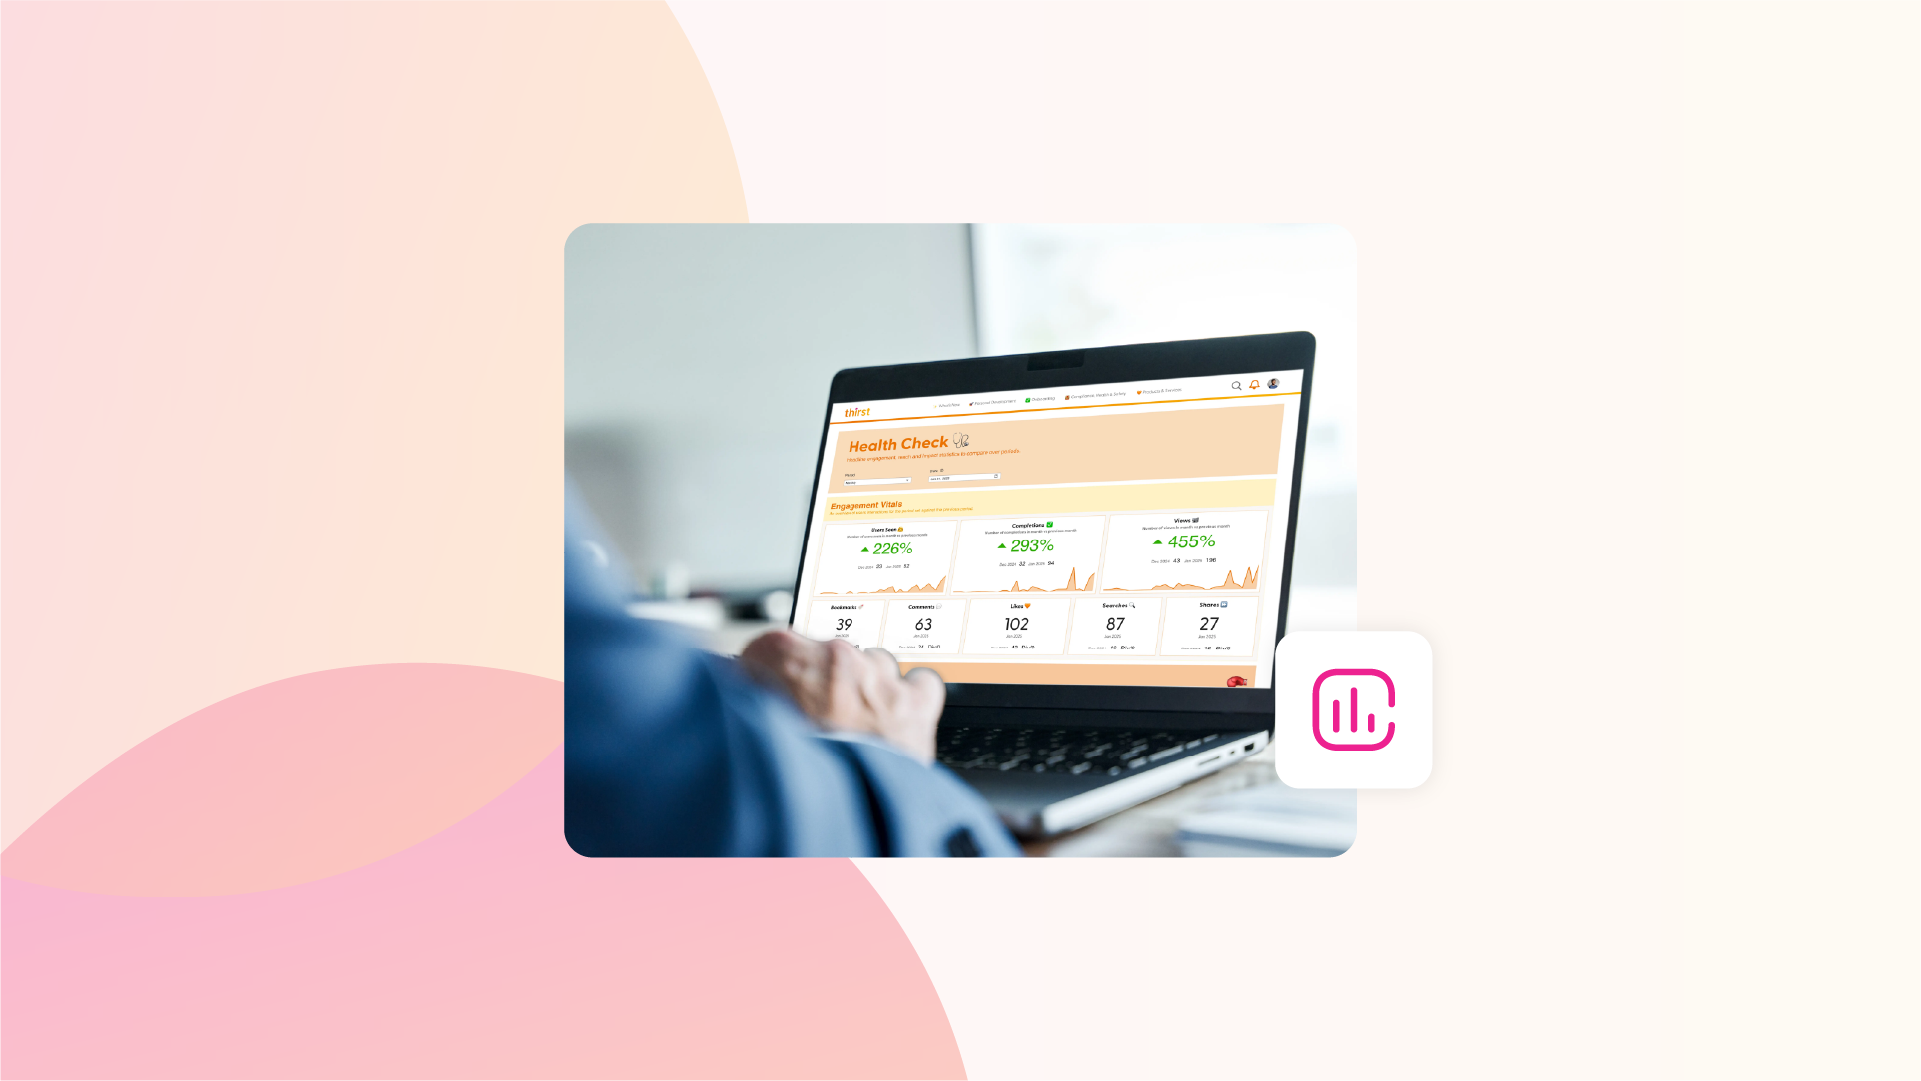
Get the Most Out of Your L&D with Deep Data Insights and Analytics
Real-Time Dashboards ✅
Forget monthly reports. You’re looking at live data, with interactive dashboards that make it easy to share wins with leadership.
Informal & Social Learning Tracking ✅
Learners chat in Slack? Watch YouTube tutorials? Join communities? The new wave of analytics can now track that, too.
Cross-System Integrations ✅
LMS + HRIS + performance tools = a 360° view of learning impact. This is where things get juicy.
How to Use LMS Analytics to Improve Learning Outcomes
Now you’ve got the data.
Here’s what to do with it…
- Spot patterns – Who’s engaging? Who’s stuck?
- Iterate faster – Update underperforming content.
- Personalise learning – Serve up the right content to the right learner, at the right time.
- Prove your value – Share metrics with stakeholders that actually mean something (hello, ROI).
- Feed the loop – Use data to continuously optimise and evolve your strategy.
Common LMS Analytics Mistakes to Avoid
Even with the best tools, it’s easy to get lost.
Watch out for these pitfalls:
Only tracking vanity metrics 🚫
High logins don’t mean high impact.
Misaligned KPIs 🚫
Tracking completion when your real goal is skills development? Doesn’t add up.
Not acting on the data 🚫
Collecting metrics is step one. If you don’t do anything with them… what’s the point?
Ignoring informal learning 🚫
Modern learners aren’t just learning in the LMS. Zoom out.
Tracking everything = insight from nothing 🚫
Be selective. Focus on what drives outcomes.
Final Thoughts
2025 is the year L&D stops guessing and starts knowing.
The right LMS analytics help you:
- Design better learning
- Spot disengagement early
- Prove real impact
- And make learning personal (at scale)
If your current LMS can’t deliver these insights, it may be time to upgrade. 👀
Thirst is designed for modern L&D teams who want less chaos, more clarity, and a platform that helps them grow their people.
Got 2 Minutes?
If your organisation is struggling with disengaged learners, Thirst has the solution. 🔥
Thirst is an AI-powered learning platform that helps L&D teams of all sizes boost learner engagement and create experiences tailored to today’s learners.
Take a guided tour today and see Thirst in action.
For more e-learning insights, resources and information, discover the Thirst blog.
You may also enjoy:
The Importance of Learning in the Flow of Work for L&D | 7 Ways to Build a Lifelong Learning Culture that Drives Employee Growth | Upskilling and Reskilling: Why it is the Future of Work