As an L&D pro, you know that employee development plays a vital role in the success of any organisation.
But how do you know if your L&D efforts are making a difference? 🤔
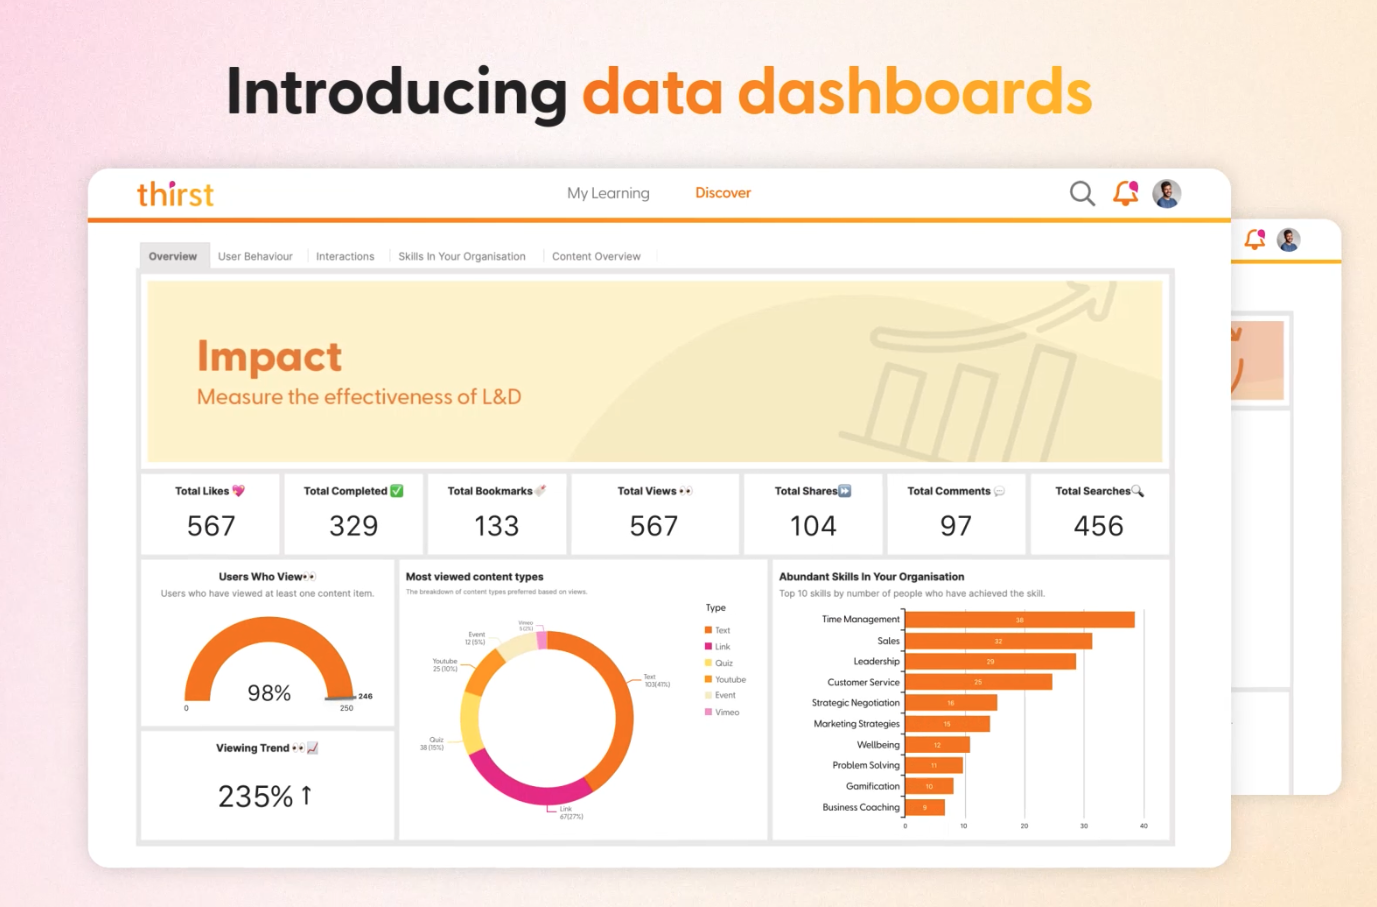
That’s where Thirst’s new Data Insights and Analytics Dashboard comes in!
With this powerful feature, you can finally connect the dots between skills, internal mobility, and retention with deep insights that demonstrate the true impact of L&D across your organisation.
Are you ready to level up your L&D? 🚀 Let’s dive in! 👇
Find Skill Gaps in Your Organisation
Uncover areas where your organisation may be lacking in vital skills. You can then adjust your L&D programs to ensure learners are gaining the skills they need to succeed in their roles and careers.
By doing this, you can ensure your organisation is well-equipped to tackle skills gaps and future business needs with upskilling programmes.
Ensure L&D Success with Progress Tracking
See how your learners are progressing through their training.
With Thirst, you can unlock…
🧠 Which topics are being covered
⌛ How much time learners are spending on each topic
✅ How much of the content they are completing
You can then identify areas where learners may be struggling and provide additional support, ensuring they can achieve peak performance and succeed in their careers 💪
Identify Trends and Patterns with Quiz and Assessment Results
Get deeper insights into how well learners are understanding learning content and topics.
Then leverage this data to develop targeted training programs that improve employee performance, boost productivity, better customer service, and increased profitability. 📈
Boost Employee Engagement and Motivation
Discover how engaged your learners are with their training and how often they log in to the platform, how long they spend on each session, and which features they use most frequently.
This allows you to understand where learners may be disengaged and adapt your L&D programmes to keep them engaged and motivated. 🙌
Demonstrate the Impact, ROI, and Effectiveness of Your L&D Efforts
Struggling to show the key stakeholders the difference L&D is making? 🤯
With Thirst dashboards, you can see whether your L&D programs are helping learners achieve their career objectives, improving job performance and enhancing productivity.
Thirst allows you to adjust your L&D programs to ensure they are having the desired outcomes for your business. 📊
Customise Your Dashboard and Reports Just the Way You Like Them
Choose the data points that are most impart to you and export the data in various formats for further analysis.
This allows you to get the insights you need to make data-backed decisions about your L&D programs.
Thirst’s Data Insights and Analytics Dashboard provides the insights you need to make better decisions about your L&D programs, ensuring your learners are getting the support they need to grow their careers and your organisation is well-equipped to tackle the challenges of the future.
Ready to learn more? Book a demo today and learn how Thirst can accelerate your learning culture. 👇