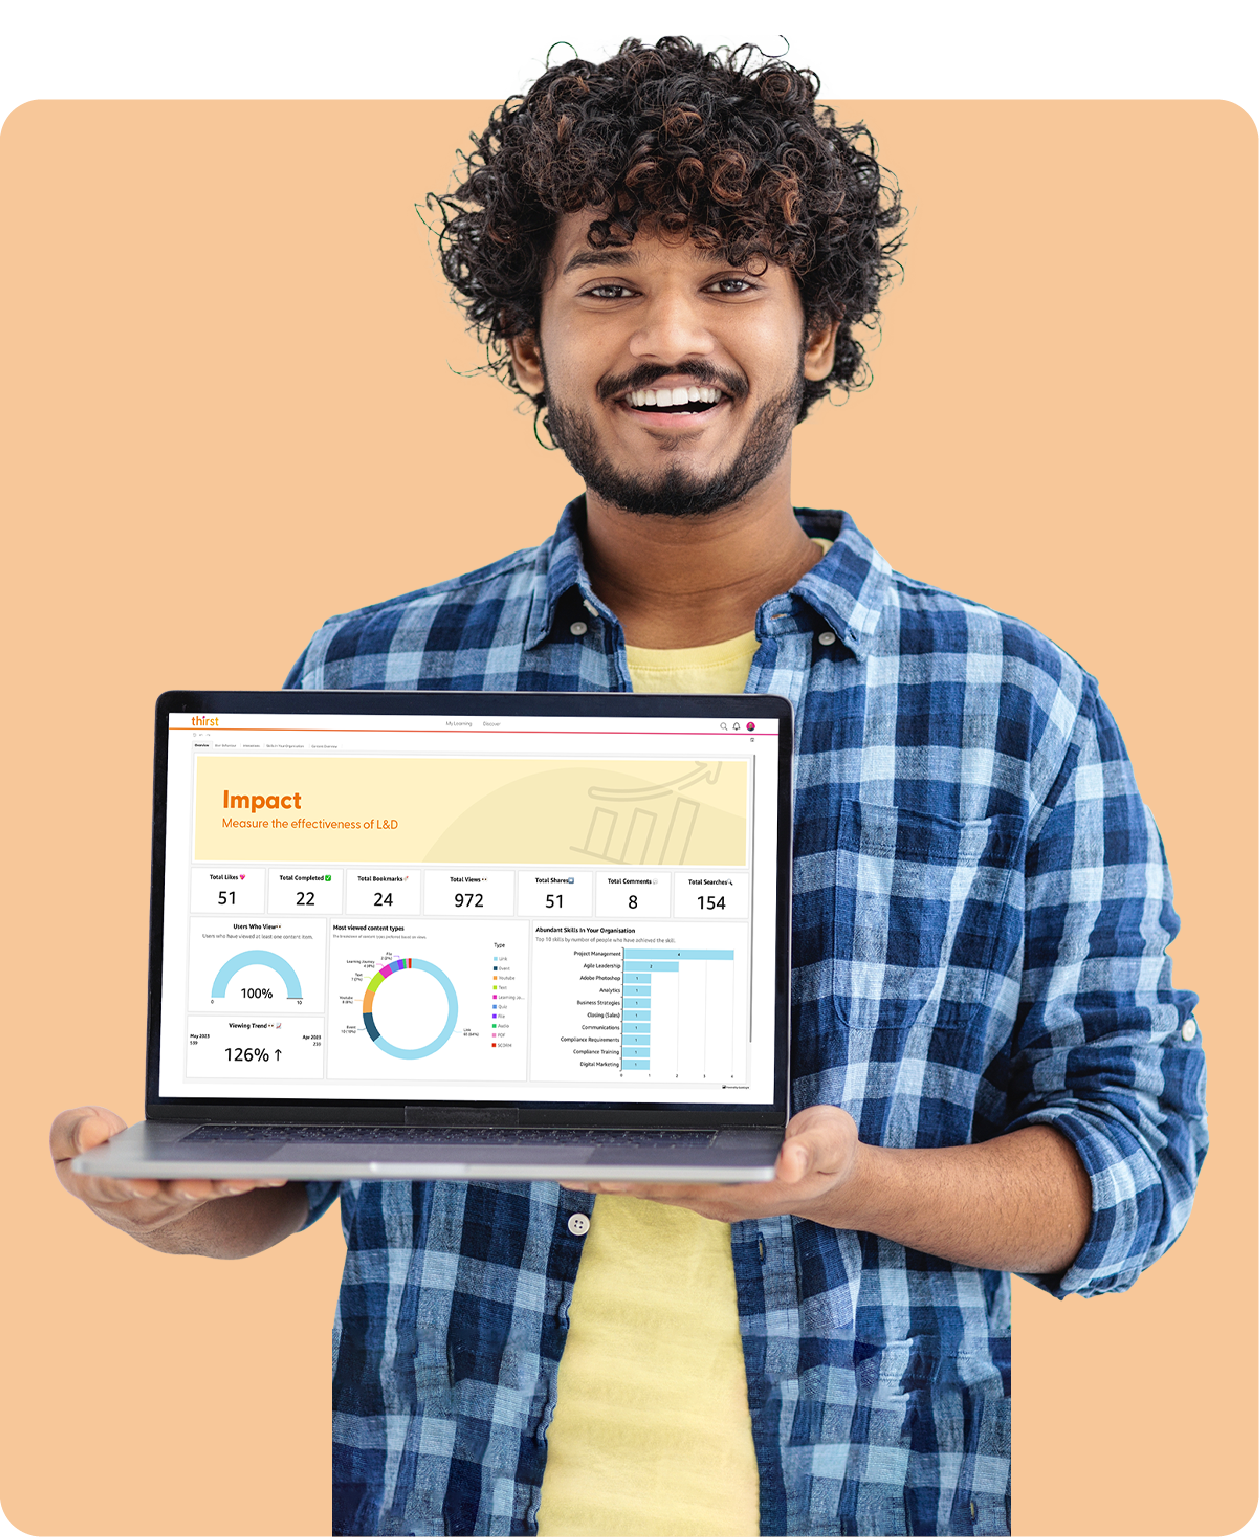
Thirst enables you to track and analyse user behaviour, engagement metrics, content performance, skill assessment results, learning path progress, and more. You can gather comprehensive data that gives you valuable insights into the effectiveness of your L&D programmes.
Benefits
Data That Makes a Difference
Engagement & Behaviour
Identify areas for improvement, and optimise learning experiences for maximum impact.
Content Insights
Understand which learning resources resonate most with learners and make data-driven decisions that improve content quality and relevance.

Skills Gap Analysis
Evaluate skill levels, identify skill gaps, and design targeted learning programmes to close them faster.
Make Data-Driven Decisions
Harness the power of deep data and insights to measure the effectiveness of your L&D programs. Track user behaviour, engagement, and progress to gain valuable insights into the impact of L&D across your organisation.
Optimise Learning Experiences
Identify areas where you can improve learning content and ensure your L&D efforts always align with your organisational goals.
Drive Continuous Improvement
Uncover trends, patterns, and learner preferences to refine training programmes, adapt learning paths, and enhance the experience for learners.
Identify and Develop In-Demand Skills
Stay ahead of the skills curve, Thirst’s deep data and insights lift the lid on the in-demand skills, emerging trends and future skill requirements to meet the evolving needs of your organisation.
Personalised Learning Journeys
Understand individual learning preferences, skill gaps, and career aspirations then tailor learning pathways and assessments to meet the unique needs of each learner.

Data Visualisation & Reporting
Create customisable dashboards, comprehensive reports and visualise data trends, and present insights that connect the L&D dots to stakeholders.

“The power of Thirst and the ability it has to deliver personalised content to each learner has meant that since we launched the platform, we have consistently maintained 98% learner engagement.”
Tim Payne
CEO, Clarus WMS
Frequently Asked Questions
Take a look at our most commonly asked questions.
How customisable are the analytics and reports?
Thirst lets you tailor reports to your specific needs – choose relevant data visualisations and time periods, and generate comprehensive reports that give you the complete picture of your L&D programmes.
Can the analytics and reporting features help measure the impact of L&D programmes?
Absolutely! Thirst is designed to measure the true impact of your L&D in your organisation. You can track key metrics, assess skill development, measure knowledge retention, and demonstrate the ROI of L&D.